One Door
View Demo

ONE DOOR · Intelligence

From interest to insight.

02 · Demand Intelligence Patent Pending

Understand what patients need.

Demand Intelligence connects patient interest to operational questions: what patients are exploring, which education pathways are used, where requests originate, and where patients stop before reaching care. It is designed to help practices and hospitals plan, not to replace clinical judgment.

Actual historical One Door website performance

Real engagement. Measured over time.

These figures are taken from the supplied One Door project engagement report and reflect activity across earlier website iterations and campaigns, before the new application launch. They are measured website engagement—not application-generated results, booked visits, or clinical outcomes.

10.9KSessionsGA4 · reporting period in source report
9.32KNew usersGA4 · reporting period in source report
47.6KEventsGA4 · reporting period in source report
2,644Form viewsWix · Aug 27, 2024 onward, per report
110Forms startedWix · Aug 27, 2024 onward, per report
59Forms submittedWix · Aug 27, 2024 onward, per report
59IPSS records captured in CMS · all time
66Direct contacts (calls/messages) · all time
20Walking assessment page visits · all time

Source: user-provided One Door Total Project Engagement report (GA4, Wix Analytics and Wix CMS). Reporting periods vary by metric. These are historical aggregate counts, not unique patients, confirmed appointments, or independently audited outcomes.

What people explored · historical site data

Patient interest, before the app.

These are real recorded page-session counts from the supplied project report, aggregated across earlier One Door website iterations. They are not clinical diagnoses, patient counts, or proof of completed appointments.

Frequent Urination / BPH6,186
Homepage1,694
Fibroid education (Spanish)743
Enlarged prostate education (Spanish)420
Treatment comparison354
Prostate symptom score187

Source: user-provided Total Project Engagement report, top pages by sessions (all time). Some traffic may reflect repeated sessions or historical campaigns; the figures should not be interpreted as unique patients.

Measure the digital front door

Website sessions, pathway engagement, care requests and funnel steps are distinct measures. A session is not a unique patient and a request is not a completed booking.

Understand condition-level interest

Compare topics, assessment engagement and requests over time. Segment by specialty and location where data quality and privacy thresholds permit.

See geographic patterns

Regional maps can reveal concentrations of demand and potential access gaps. Low-count suppression and privacy safeguards are necessary.

From signal to action

Use insights to improve education, identify referral friction, evaluate outreach and prioritize access improvements. Analytics alone cannot establish clinical need or causation.
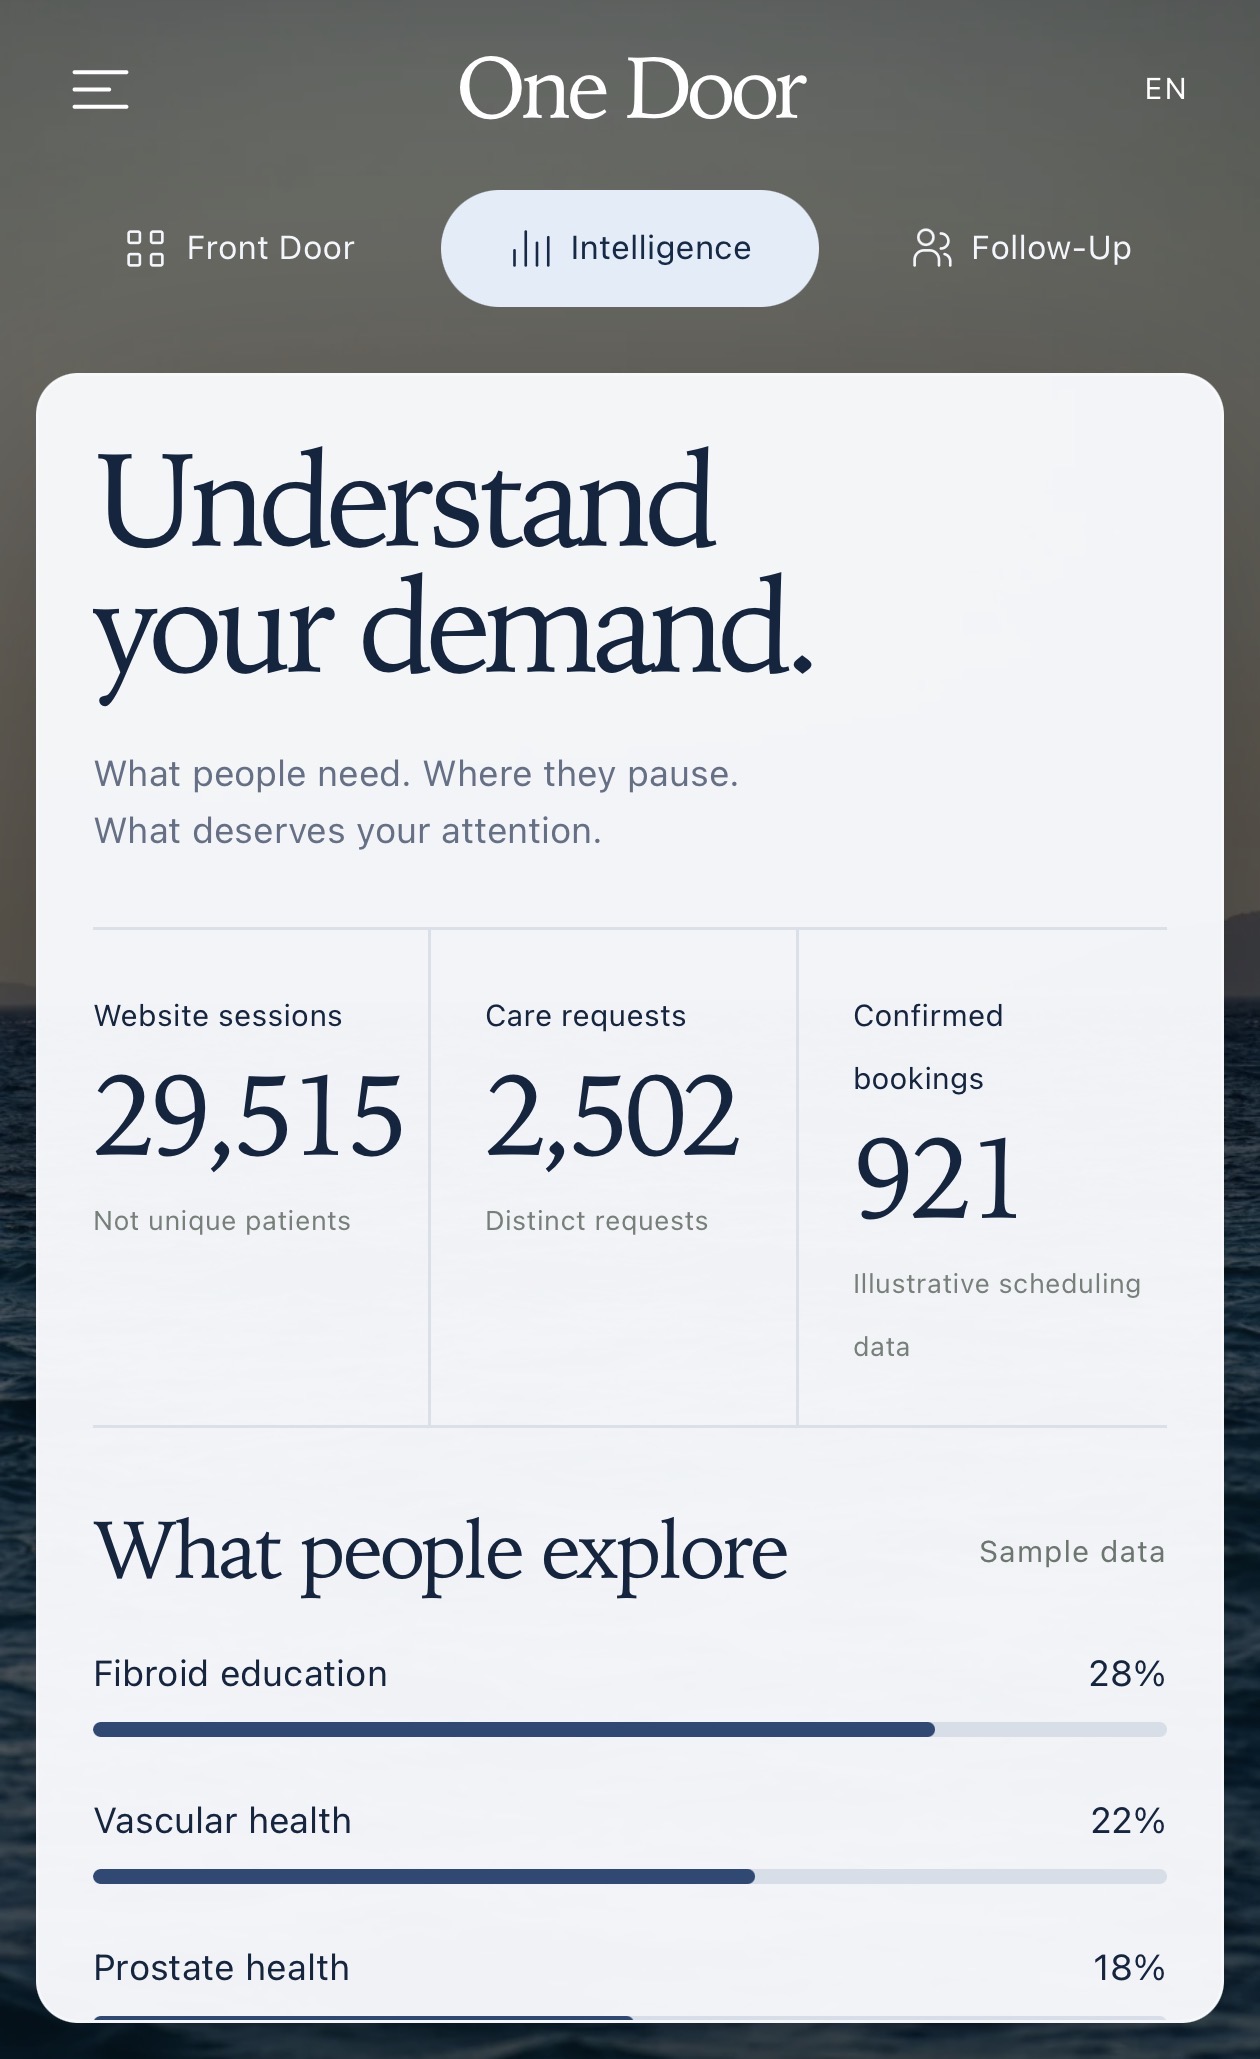
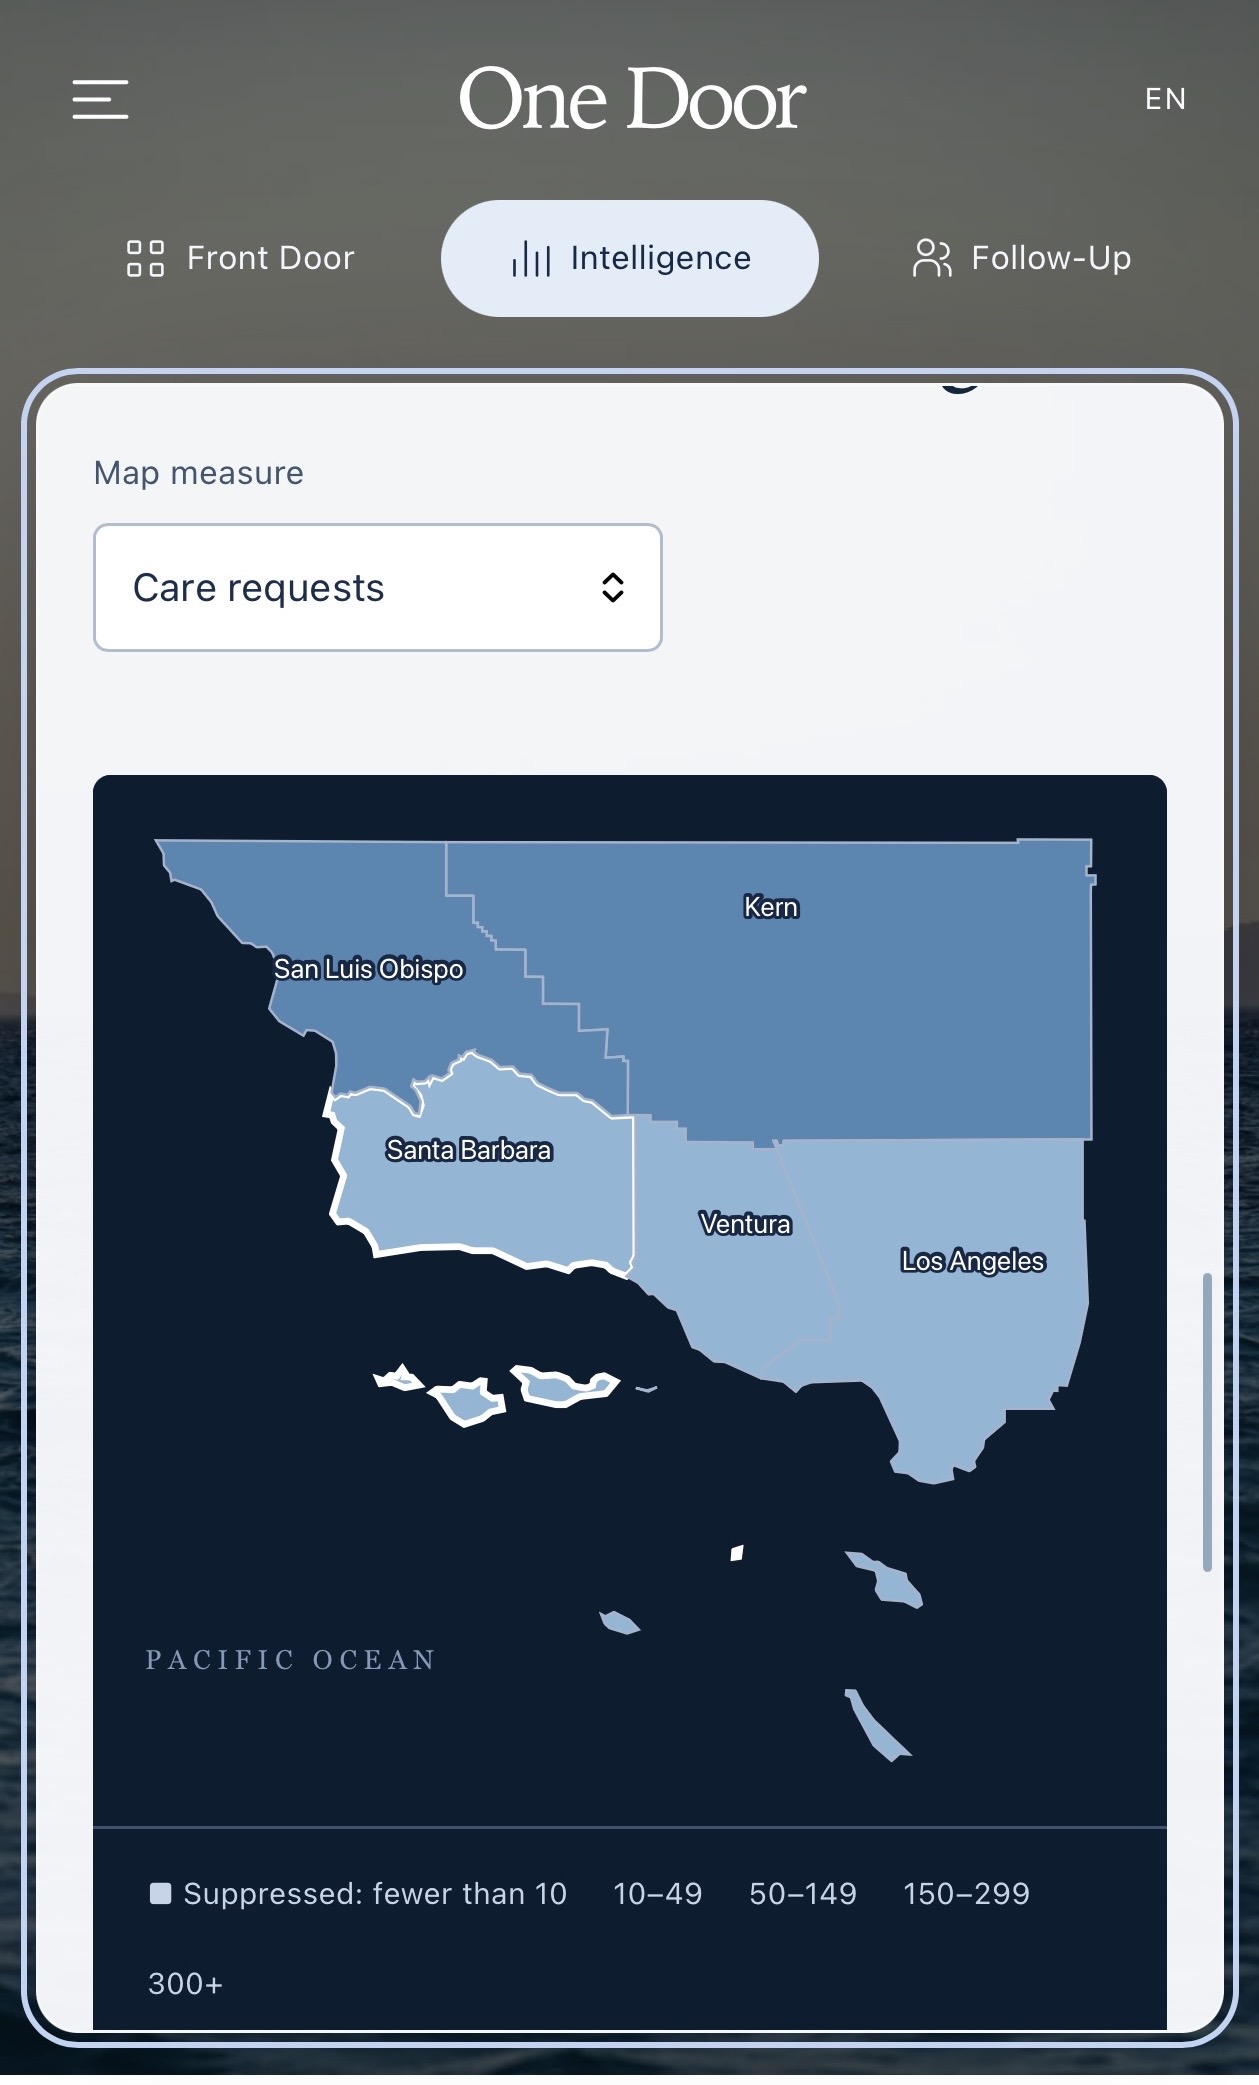
Private application design preview with illustrative dashboard figures
Application interface preview · illustrative dashboard values, separate from the historical metrics above
Southern California demand visualization
Regional demand map · illustrative values

What is demonstrated

Interactive dashboard and geographic map concepts using sample data.

What remains to validate

Production event collection, attribution, data quality, access permissions, consent and privacy controls, reporting accuracy and integration with confirmed bookings.

What we will not claim

No real-world patient volume, predictive clinical accuracy, verified ROI, or live hospital integration is established by these screenshots.

Product transparency. The screenshots represent private design previews using fictional information. Availability of production accounts, patient data, automated handoffs, EHR connections, and native mobile applications is not implied.

View Intelligence preview For health systems